The Affordable Care Act (ACA) expanded health insurance coverage in part by prohibiting discrimination against people with pre-existing conditions and offering subsidies to low-income people purchasing through newly-created exchanges on the individual insurance market. In this analysis, we use publicly-available federal enrollment data and administrative data insurers report to the National Association of Insurance Commissioners (as compiled by Mark Farrah Associates) to measure changes in enrollment in the individual market before and after the ACA’s coverage expansions and market rules went into effect in 2014 through the first quarter of 2018.
The individual market comprises coverage purchased by individuals and families through the ACA’s exchanges (Marketplaces) as well as coverage purchased off-exchange, which includes both plans complying with the ACA’s rules and non-compliant coverage (e.g., grandfathered policies purchased before the ACA went into effect and short-term plans). It is a relatively small market as a share of the U.S. population, with about 10.6 million people enrolled in 2013 before the ACA went fully into effect1.
Our analysis finds that, after increasing substantially (by 64% to 17.4 million people in 2015) following implementation of the ACA, enrollment in the individual market remained relatively unchanged in 2016 (at 17.0 million) then declined by 12% to 15.2 million in 2017. Enrollment has continued to fall in early 2018: first quarter enrollment has declined by 12% in 2018 compared to the first quarter of 20172. Much of this decline in overall individual market enrollment was concentrated in the off-exchange market, where enrollees are not eligible for federal premium subsidies and therefore were not cushioned from the significant premium increases in 2017 and 2018. Despite the recent decline in overall individual market enrollment, there are still 14.4 million people enrolled as of the first quarter of 2018, compared to 10.6 million people in 2013.
Changes in Enrollment through 2018
As the ACA market rules and premium subsidies were implemented in 2014, there was significant growth in enrollment on the individual market. For the first time in nearly all states, people with pre-existing conditions could purchase coverage on an open marketplace and low-income people were eligible for tax credits to help pay their premiums and reductions in their cost sharing. In addition, many people who went without insurance coverage had to pay a tax penalty. As of 2014, health plans had to follow new rules that standardized benefits and guaranteed coverage for those with pre-existing conditions when selling coverage to new customers (known as “ACA-compliant” plans). Following these changes, individual market enrollment increased substantially, expanding from 10.6 million members on average per month in 2013 to 17.4 million members in 2015 (Figure 1)3. This included an estimated 3.5 million people in non-ACA compliant plans — including short term plans, grandfathered plans, and plans purchased before October 2013 that were allowed to continue under a federal transition policy at the discretion of states and insurers.
In 2016, total individual market enrollment was relatively unchanged from the previous year (at 17.0 million), though there was an apparent shift from non-compliant to ACA-compliant plans. In 2016, enrollment in non-compliant plans decreased by 1.3 million (38%), while ACA compliant enrollment (including both on and off-exchange plans) increased by 1 million people.
Enrollment in the total individual market began to decline in 2017. Both compliant and non-compliant enrollment declined, suggesting that people ending transitional, non-compliant policies were not necessarily moving to the ACA-compliant market. In 2017, the individual market covered 15.2 million people on an average monthly basis, including 13.3 million people in compliant plans on and off the exchanges and 1.8 million people in non-compliant plans.
First quarter enrollment data from 2018 shows that total individual enrollment continues to decline, even as enrollment on the ACA exchanges has remained relatively stable (see Figure 3). 14.4 million people are enrolled in the individual market as of the first quarter 2018, 12% lower than the first quarter of 2017 – a drop of about 2 million.
Figure 1: Individual Market Enrollment, 2011 – 2017
Changes in On vs. Off-Exchange Enrollment
After peaking at 11.1 million people in 2016, exchange enrollment has declined somewhat but has largely remained stable. In the first quarter of 2018, 10.6 million people were covered on the ACA exchanges, including 9.2 million people receiving federal premium subsidies (Figure 2)4.
Figure 2: Q1 Exchange Enrollment, 2015 – 2018
Declining off-exchange enrollment accounts for much of the drop in individual market enrollment since 2016. Total individual market enrollment began to decline in 2017 and has continued to fall in the first quarter of 2018 (Figure 3). Total individual market enrollment declined by 2 million people (12%) from the first quarter of 2017 to the first quarter of 2018. All of this decline was in the off-exchange market, which fell by 2.3 million people (38%). Exchange enrollment increased slightly by 313 thousand people (3%), reflecting an increase in enrollment among subsidized enrollees and a decrease among those not eligible for subsidies5. The “silver loading” of premiums in response to termination of cost-sharing subsidy payments to insurers in late 2017 inflated premium subsidies in 2018 and made zero-premium bronze plans possible for many more people. This may have boosted enrollment among subsidized consumers in 2018.
Figure 3: Change in Q1 Enrollment, 2017 – 2018
Off-exchange enrollment includes ACA-compliant plans that are sold outside of the exchange but are part of the same risk pool. The primary distinction between on and off exchange ACA-compliant plans is that subsidies are only available through the exchange. To the extent that fewer people in good health buy off-exchange ACA-compliant plans, premiums in on-exchange plans are affected as well. Non-compliant plans – including grandfathered and short-term plans – that are not part of the ACA risk pool -are also included in off-exchange enrollment. In 2017, 3.6 million people were covered by off-exchange ACA compliant plans, and 1.8 million people had non-compliant plans6.
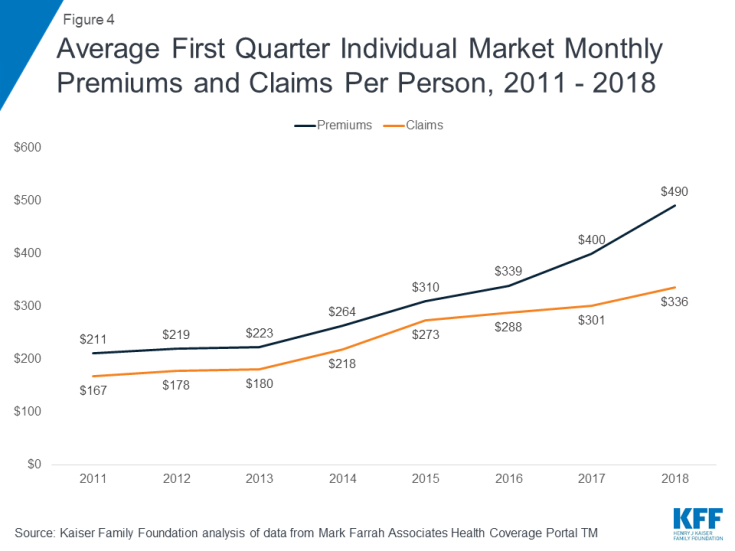
The decline in individual market enrollment coincides with significant premium increases in 2017 and 2018. In the early years of the ACA exchanges, insurers underestimated how sick the new risk pool would be and set premiums too low to cover their claims. A number of insurers then exited the market and the remaining insurers raised premiums substantially on average to match their costs (Figure 4). Our analysis of insurer financials showed the market was stabilizing by 2017 and insurers were starting to become profitable in the individual market for the first time under the ACA. Signs pointed toward the 2017 premium increases being a one-time market correction. However, premiums increased again in 2018, in large part compensating for uncertainty around enforcement of the individual mandate and the termination of cost sharing payments.
Figure 4: Average First Quarter Individual Market Monthly Premiums and Claims Per Person, 2011 – 2018
While the vast majority of exchange consumers receive subsidies that protect them from premium increases, off-exchange consumers bear the full cost of premium increases each year. In 2017, states that had larger premium increases saw larger declines in unsubsidized ACA-compliant enrollment (Figure 5), suggesting a relationship between premium hikes and enrollment drops.
No data are available to determine what is happening to people who have dropped off-exchange coverage. Some may now qualify for subsidies as premiums have risen, some may have obtained coverage elsewhere (e.g., through employer plans, or health care sharing ministries, which are not considered insurance and do not file any enrollment or financial information to regulators), and some may be uninsured.
Figure 5: State Changes in Average Benchmark Premium vs Unsubsidized Enrollment, 2016 – 2017
As off-exchange, unsubsidized enrollment has fallen, the total individual market has increasingly become dominated by subsidized enrollees. In the first quarter of 2018, nearly two-thirds of enrollees in the total individual market are subsidized (Figure 6).
Figure 6: Subsidized vs. Unsubsidized Share of Q1 Individual Market Enrollment
Discussion
Looking ahead to 2019, the repeal of the individual mandate penalty has raised concerns of further enrollment declines in the individual market, particularly among people who are healthier than average. The expected expansion of loosely-regulated short-term health plans will also likely siphon away healthy people, pushing premiums up further for ACA-compliant plans on and off the exchange.
While the majority of people on the exchanges receive subsidies and will be protected from premium increases, middle-class people who do not qualify for subsidies will feel the brunt of future premium increases. This is especially true of people with pre-existing conditions who likely would not qualify for short-term plans that base eligibility and premiums on people’s health.
The availability of premium subsidies – which rise along with premiums – is likely sufficient to keep the individual insurance market financially sustainable in the face of policy changes and enrollment declines. However, based on the current trajectory, the market is likely to be increasingly dominated by lower-income people and those with pre-existing conditions.
Methods
We analyzed publicly-available federal enrollment data from the Centers for Medicare and Medicaid Services (CMS), and insurer-reported enrollment and financial data from Health Coverage Portal TM, a market database maintained by Mark Farrah Associates, which includes information from the National Association of Insurance Commissioners (NAIC) and the California Department of Managed HealthCare. All total enrollment figures in this data note are for the individual health insurance market as a whole, which includes major medical insurance plans sold both on and off exchange.
Exchange and compliant enrollment are from the Centers for Medicare and Medicaid Services (CMS). Total individual market enrollment is from administrative data insurers report to the National Association of Insurance Commissioners, and compiled by Mark Farrah Associates: annual enrollment is from the Supplemental Health Exhibit and first quarter enrollment is from the Exhibit of Premiums, Enrollment, and Utilization for health companies and rolled over from the prior year Supplemental Health Exhibit for life companies. Off-exchange enrollment is estimated by subtracting exchange enrollment from total enrollment in the individual market. Non-compliant enrollment is estimated by subtracting compliant enrollment from total enrollment in the individual market. CMS does not collect enrollment data for off-exchange ACA compliant plans in Massachusetts or Vermont; in these states non-compliant enrollment was estimated by applying the national average share of non-compliant off-exchange members to statewide off-exchange enrollment.
Annual enrollment figures from 2011 – 2017 are for average monthly enrollment. Quarterly enrollment figures in 2018 are for effectuated enrollment (i.e., people who paid their first month’s premiums). Annual filings provide a more complete picture of the individual market and allow for estimates of compliant vs non-compliant enrollment. Quarterly filings provide a sense of how enrollment is changing on a more current basis. First quarter enrollment tends to be higher than average annual enrollment because the number of people who drop coverage throughout the year exceeds the number who purchase coverage through special enrollment periods outside of annual open enrollment.